作者:微信小助手
发布时间:2025-03-20T12:43:05
在小北的读者群里,无数小伙伴为了拿高薪,疯狂卷大厂面试、卷架构师面经。有一个问题,几乎成了面试必考题: “你们系统QPS多少?你怎么知道的?如果每天几千万请求,系统怎么部署?” 这题堪称面试界的“钉子户”,10个面试9个问! 文末附有满分面试回答 QPS = 每秒查询数(Query Per Second),简单说就是服务器1秒能接多少活。 QPS越高,说明系统越能扛! 举个栗子: 假设系统每天1000万请求: 这意味着:系统必须能稳定扛住370 QPS,否则高峰期必崩! 在项目的 访问 这表示: 去官网下个压缩包,解压后改 访问 这个公式的意思是:统计5分钟内,/api/order接口每秒的请求数 效果图: 如果系统有多个接口(比如订单、支付、用户),可以在Grafana里: 最终效果: 缺点: 效果: CPU超过80%时,自动新增Pod,最多10个实例 面试官: 你们系统QPS多少? 我们的订单系统峰值QPS在1200左右,通过Prometheus+Grafana实时监控。 面试官OS: 这哥们是真干过! 要想QPS答得好,三板斧不能少:说在前面
今天,小北就用多年开发经验,带大家手撕这个题,从理论到实操,从监控到部署,让你面试时怼得面试官心服口服!
一、QPS扫盲
1.1 什么是QPS?
举个例子:
1.2 QPS、TPS、RT的关系
🔹 TPS(每秒事务数)
🔹 RT(响应时间)
三者的数学关系
QPS = 并发数 / RT
TPS = QPS × 每个请求的事务数
1.3 必须知道的性能公式
📈 二八定律算峰值QPS
峰值QPS = (总请求 × 80%) / (24h × 20% × 3600秒)
= (10,000,000 × 0.8) / (6 × 3600)
≈ 370 QPS
二、实战!监控QPS的4步大法
2.1 第一步:给Spring Boot装“监控探头”
加依赖
pom.xml里塞两个“监控神器”:
<dependency>
    <groupId>org.springframework.bootgroupId>
    <artifactId>spring-boot-starter-actuatorartifactId>
dependency>

<dependency>
    <groupId>io.micrometergroupId>
    <artifactId>micrometer-registry-prometheusartifactId>
dependency>
改配置
application.yml里开放监控端口:management:
endpoints:
web:
exposure:
include: "*" # 开放所有监控指标
metrics:
web:
server:
request:
metric-name: http.server.requests # 统一指标名 启动项目,查看指标
http://你的IP:端口/actuator/prometheus,你会看到:http_server_requests_seconds_count{uri="/api/order",status="200"} 358
http_server_requests_seconds_sum{uri="/api/order",status="200"} 28.5
/api/order接口被调用了358次(count)
sum)
2.2 第二步:部署Prometheus(监控数据中心)
安装Prometheus
prometheus.yml:scrape_configs:
- job_name: '你的服务'
metrics_path: '/actuator/prometheus'
static_configs:
- targets: ['你的IP:端口'] # 改成你的服务地址 启动命令
./prometheus --config.file=prometheus.yml http://localhost:9090 就能看到监控数据啦!
2.3 第三步:用Grafana搞个炫酷看板
配置数据源
http://localhost:9090 → Save & Test
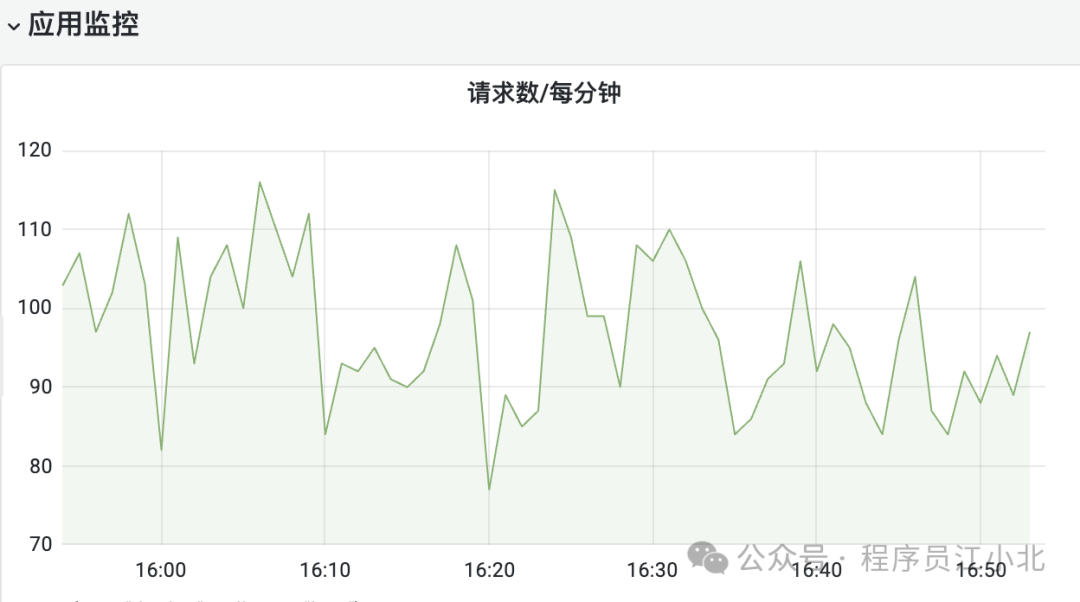
创建QPS监控图
rate(http_server_requests_seconds_count{uri="/api/order"}[5m])
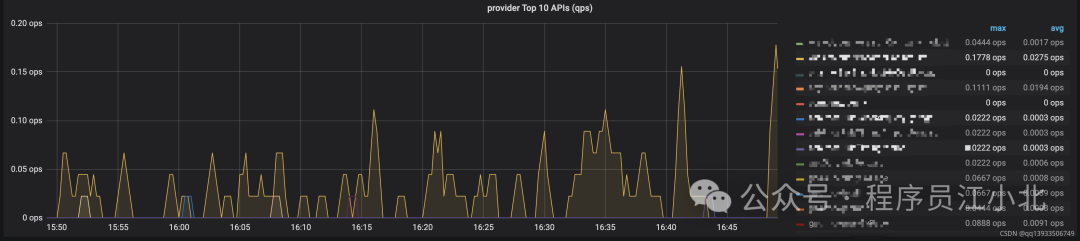
2.4 第四步:高级操作——区分不同接口
legend字段显示uri标签
rate(http_server_requests_seconds_count{uri=~"/api/.*"}[5m])
三、千万级流量的部署秘籍
3.1 初级方案:单体架构升级
纵向扩容(Scale Up)
3.2 进阶方案:微服务拆分
拆分策略
技术选型
3.3 高级方案:弹性伸缩
K8s + 云服务
apiVersion: autoscaling/v2
kind: HorizontalPodAutoscaler
spec:
  scaleTargetRef:
    apiVersion: apps/v1
    kind: Deployment
    name: order-service
  minReplicas: 2
  maxReplicas: 10
  metrics:
  - type: Resource
    resource:
      name: cpu
      target:
        type: Utilization
        averageUtilization: 80
3.4 全链路优化
分层优化策略
网关层
服务层
缓存层
DB层
四、面试满分指南
4.1 满分回答模板
你:
为了支撑每天2000万请求,做了三方面优化:
这是我们的监控看板截图,可以看到......(拿出手机展示)
4.2 防坑指南
千万别说
加分话术
五、总结